Layer 1: the official API
Device activity logs, alerts and status read through the official UniFi API — no agent installed on your network and no inbound ports opened.

Technical whitepaper
How GNS CARE works: we read device activity logs through the official UniFi API, send them over an encrypted channel to our own cloud platform and use SIEM and anomaly detection to compare each device against its own baseline, acting before hardware fails. This paper covers the architecture, how it differs from traditional Hong Kong IT maintenance, the practical benefits and public overseas practice.
The point of monitoring is not to record failures afterwards, but to find them before they happen.
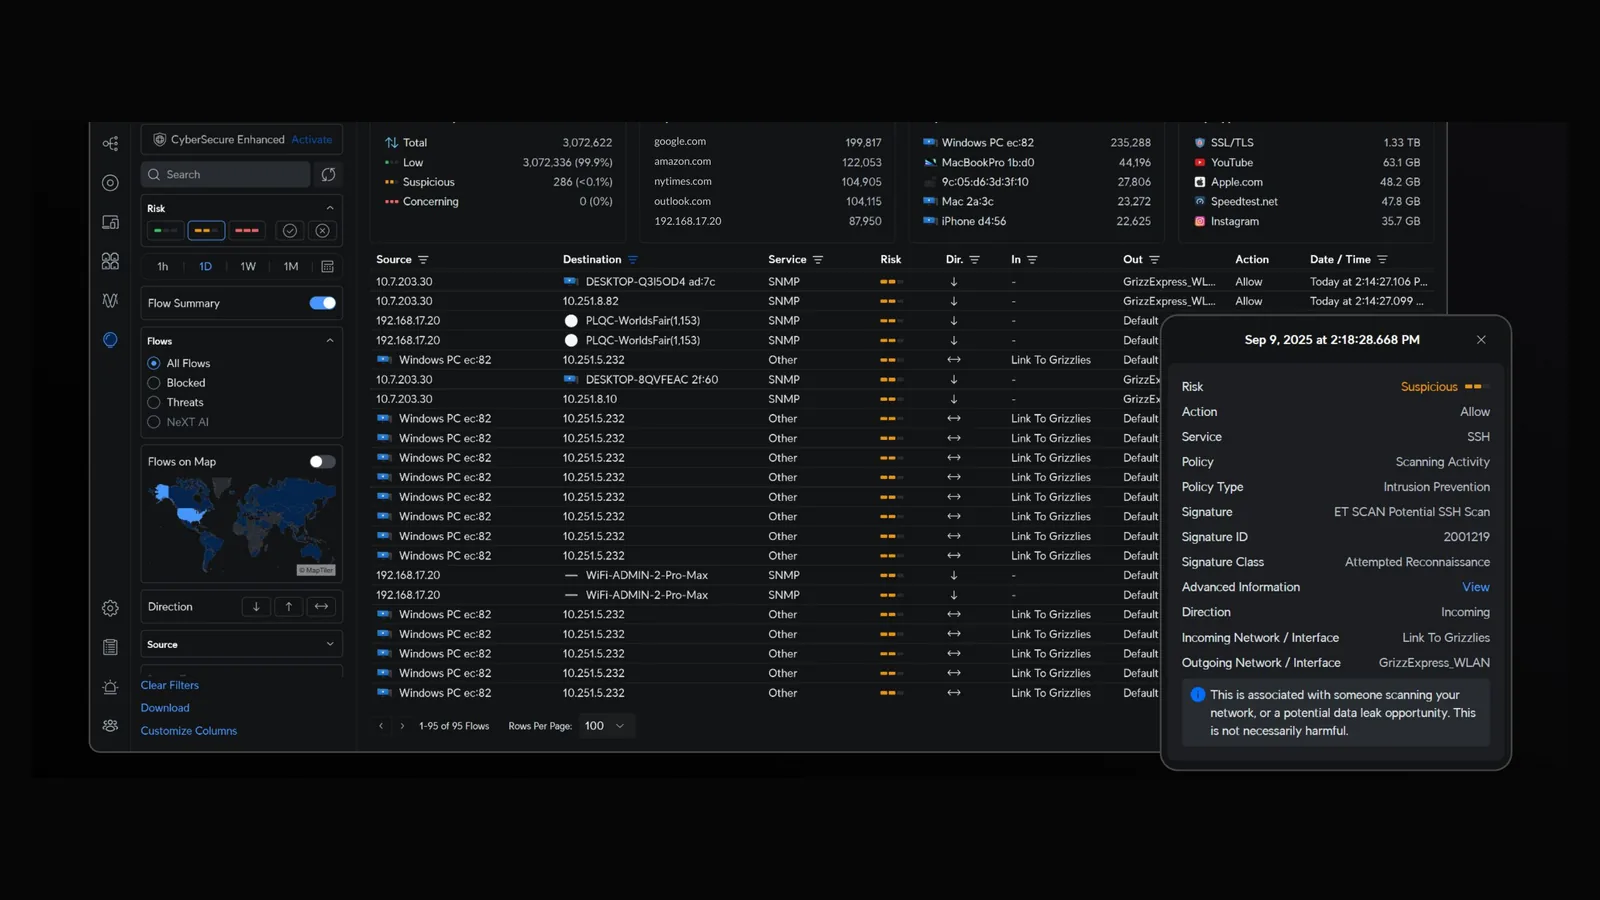
Traditional IT maintenance is reactive: you report a fault, an engineer attends, and by then the failure has already happened. That model still works when hardware is sparse and systems are unrelated — but when one company depends on Wi-Fi, CCTV, door access and intercom at the same time, a single failure is enough to stop operations.
This paper describes a different starting point: collect device activity logs first, then compare them against a baseline. We read device logs through the official UniFi API, send them over an encrypted channel to our own cloud platform, correlate them in a SIEM (security information and event management) around the clock, and then hand the result to an AI platform we build and run ourselves. It combines those correlations with each device’s long-term baseline to name the units that are about to fail, suggest what to change in placement or configuration, and order the replacements before the hardware actually dies. When a drive, a power supply, a link or wireless coverage starts drifting away from normal, the signal reaches us before the customer notices, and we arrange the repair or the replacement up front.
This paper covers:
The problem
None of these are about how skilled the provider is — they are limits of the reactive model itself.
The trigger for break-fix maintenance is your phone call. Before that call the provider knows nothing about the state of the equipment; after it, the time goes into recovery rather than prevention.
An on-site inspection is a snapshot: if the unit powers on and connects while the engineer is standing there, it passes. Drive read errors, power-supply voltage swings and roaming failures never appear in that snapshot.
One supplier covers the hardware, another maintains the network, and the records live in separate systems. When a problem crosses that boundary, the time goes into coordination rather than repair.
Comparing the models
The difference is not the price. It is when the problem is found, and what the decision to replace is based on.
| What is included | Traditional on-site maintenance Charged per visit | Plain remote monitoring Instant alerts only | GNS CARE API telemetry + SIEM |
|---|---|---|---|
| How data is collected | |||
| Source of data | Traditional on-site maintenance On-site inspection only | Plain remote monitoring Live device status | GNS CARE Device activity logs via the official API |
| Agent installed on your network | Traditional on-site maintenance Not needed | Plain remote monitoring Usually required | GNS CARE Not needed (read directly through the official API) |
| Data retention | Traditional on-site maintenance Job records only | Plain remote monitoring Short term | GNS CARE Long term, for trend comparison |
| When a problem is found | |||
| Trigger | Traditional on-site maintenance Your call | Plain remote monitoring A live value crossing a threshold | GNS CARE A baseline drift |
| Drive health | Traditional on-site maintenance Known only after failure | Plain remote monitoring Live values only | GNS CARE Trend tracked, replacement scheduled early |
| Correlation across devices | Traditional on-site maintenance Not included | Plain remote monitoring Not included | GNS CARE Included |
| How often anything is checked | Traditional on-site maintenance Annually, or on each call-out | Plain remote monitoring 24/7 alerting | GNS CARE 24/7 correlation plus a monthly report |
| Action and records | |||
| Replacement decision | Traditional on-site maintenance After failure | Plain remote monitoring After an alert | GNS CARE Before failure (Complete tier swaps within 24 hours) |
| Monthly written report | Traditional on-site maintenance Not included | Plain remote monitoring Partial | GNS CARE Included |
| Auditable event record | Traditional on-site maintenance Not included | Plain remote monitoring Not included | GNS CARE Included |
Architecture
Every layer deliberately avoids putting third-party software inside your network.
Device activity logs, alerts and status read through the official UniFi API — no agent installed on your network and no inbound ports opened.
Logs travel over an encrypted channel to our cloud platform, and are encrypted in storage as well. Only authorised engineers can read them.
A platform we operate ourselves holds the telemetry, isolated between customers, and keeps the history that trend comparison needs.
The SIEM correlates events across devices while anomaly detection compares each device against its own long-term baseline. Only when both agree does it become a signal we act on.
An AI platform we build and operate takes over here: it combines the SIEM correlations with each device’s long-term baseline to name the units about to fail, order the replacements, and suggest what to change in placement or configuration.
What the official API exposes
Every field below comes from Ubiquiti developer documentation (Network API v10.4.57, Protect API v7.3.60, Site Manager API v1.0.0). Nothing here comes from an agent we install or from guesswork. The first five categories list ten or more fields each; the last entry sets out honestly what the official API does not publish.
Device identity and state: id, name, model, macAddress, ipAddress, state (ONLINE, OFFLINE, UPDATING, CONNECTION_INTERRUPTED and others), firmwareVersion, firmwareUpdatable, supported, interfaces (ports, radios). Radio: channel, channelWidthMHz, frequencyGHz, wlanStandard. Live statistics: cpuUtilizationPct, memoryUtilizationPct, uptimeSec, loadAverage1Min/5Min/15Min, lastHeartbeatAt, nextHeartbeatAt, uplink.
Device: id, name, model, macAddress, ipAddress, state, firmwareVersion, firmwareUpdatable, supported, adoptedAt, configurationId, provisionedAt, uplink. Live statistics: cpuUtilizationPct, memoryUtilizationPct, uptimeSec, loadAverage1Min/5Min/15Min, lastHeartbeatAt, nextHeartbeatAt. Firewall policies: action, source, destination, ipProtocolScope, connectionStateFilter, ipsecFilter, loggingEnabled, schedule, enabled, index. Site Manager host: hardwareId, type, owner, isBlocked, registrationTime, lastConnectionStateChange, latestBackupTime, reportedState. ISP line: avgLatency, maxLatency, packetLoss, uptime, downtime, download_kbps, upload_kbps, ispName, ispAsn.
Device: id, name, model, macAddress, ipAddress, state, firmwareVersion, firmwareUpdatable, supported, interfaces. Ports: idx, connector, state, speedMbps, maxSpeedMbps. PoE: enabled, standard, state, type, plus a POWER_CYCLE action to re-power one port. Stacking and aggregation: switching/lags, switching/switch-stacks, switching/mc-lag-domains. Live statistics: cpuUtilizationPct, memoryUtilizationPct, uptimeSec, loadAverage1Min/5Min/15Min.
Identity and state: id, name, modelKey, type, guid, mac, state. Video: videoMode, hdrType, activePatrolSlot. On-screen text: osdSettings (isNameEnabled, isDateEnabled, isLogoEnabled, isDebugEnabled, overlayLocation). Status LEDs: ledSettings (isEnabled, welcomeLed, floodLed). Audio: isMicEnabled, micVolume. Smart detection: smartDetectSettings (objectTypes, audioTypes). Capability flags: featureFlags (hasHdr, hasMic, hasSpeaker, hasLedStatus, supportFullHdSnapshot, videoModes). Also lcdMessage and hasPackageCamera. Actions: snapshot, rtsps-stream, ptz/goto and talkback-session.
Identity and state: id, name, modelKey, type, guid, mac, state. Arming: armMode (status, armProfileId, armedAt, willBeArmedAt, breachDetectedAt, breachEventCount, breachTriggerEventId, breachEventId). Doorbell settings: doorbellSettings (defaultMessageText, defaultMessageResetTimeoutMs, customMessages, customImages). Event push: /v1/subscribe/events streams each event (motion, smartDetectZone, smartDetectLine, smartDetectLoiter, smartDetectAudio, nfcCardScanned, fingerprintIdentified and more); /v1/subscribe/devices streams device additions, changes and removals. The same API covers sensor, light, chime, siren, speaker, fob, relay, bridge, alarm-hub and link-station.
Ubiquiti developer platform publishes Network, Protect and Site Manager only (plus mobility, innerspace and carrier-fabric), so Access and Talk have no public API. In our telemetry a reader or intercom therefore appears only as a connected client and a switch PoE port: macAddress, ipAddress, type, connectedAt, uplinkDeviceId, port state, speedMbps, maxSpeedMbps, and PoE enabled/standard/state/type.
Management starts with one approval, takes about ten minutes, and needs no third-party software on your network and no inbound port opened to the internet.
The six steps with screenshots are in the managed service centre, under “Add GNS to your UniFi management team”: see the six steps.
How it starts
The first month is where the baseline is built, and alert thresholds are still being tuned.
We review the site, the device list and the current configuration, and record the initial state of every device as the baseline to compare against later.
We take over UniFi management, enable official API collection and encrypted transport, and set alert thresholds and notification paths.
Alerts are reviewed closely and thresholds tuned to cut false positives, while backlogged firmware and configuration issues are cleared.
A report follows every month, alongside hardware health, event handling and any on-site replacement the tier includes.
Practical benefits
The benefit is not that monitoring exists — it is when the problem is found.
Problems are handled before they become failures. Even when hardware does eventually fail, the swap is already arranged instead of starting when the till or the door stops working.
Drive, fan and power-supply wear shows up in the trend, so replacement is decided by condition rather than by failure.
Device logs are correlated, so unusual logins, unexpected configuration changes and new devices coming online all leave a trace.
A fixed monthly fee priced per device endpoint means a hardware failure does not land as a surprise in one quarter’s accounts.
Devices, events and the action taken are all recorded, and the hardening add-on adds a monthly security audit report, which makes answering management, audit or compliance questions straightforward.
The AI platform does more than raise an alert: it points at the likely cause and a workable fix — repositioning an AP, separating high-traffic devices, replacing a drive that is wearing out — so each intervention also lowers the odds of the next failure.
Overseas markets
These are industry practices that can be checked in public sources, not customer case studies. Local project references are available at the site survey.
Managed service providers in North America and Europe run their service on an RMM (remote monitoring and management) platform that collects device status and alerts centrally. Public vendors include Datto, N-able, Kaseya and Auvik. In those markets this is the standard configuration rather than an add-on.
Hardware vendors have been publishing official APIs so that providers can read telemetry directly, rather than installing resident software on customer networks. The UniFi official API we use follows the same direction.
Managed services in Australia, the UK and the US are commonly priced per device per month, bundling preventive maintenance, updates and support into one fixed fee instead of charging per visit. GNS CARE is priced the same way.
Public industry research — Uptime Institute’s annual outage analysis, for example — consistently puts the hourly cost of unplanned downtime far above the cost of preventive maintenance. That gap is the main reason the managed model became standard in Europe and North America.
Third-party material referenced here is public information, used as industry background.
Scope, monthly fees and SLAs in this paper are indicative; the formal quotation governs.
FAQ
These are the questions customers ask most often when evaluating a managed service.
Ordinary maintenance starts after a failure; ours starts before one. We continuously read device activity logs through the official UniFi API, send them to our own cloud platform, and use a SIEM to correlate events around the clock and compare each device against its own long-term baseline. When a drive, a power supply or a link starts drifting, we arrange the repair or swap rather than waiting for your call.
SIEM stands for security information and event management. It collects events from many devices in one place and looks for relationships between them. One alert may be noise, but when failed logins, a configuration change and a new device all appear together, correlation shows a single event to handle rather than three unrelated blips.
The API reads UniFi management data only: device status, activity logs, alerts and configuration. The managed service never needs access to files, email or line-of-business systems, and it does not read CCTV footage. What we collect is device health and event records. Logs travel encrypted and only authorised engineers can read them.
No. Because we read the data through the official UniFi API, there is no agent on your network and no inbound port to open, which also keeps the managed service from widening your attack surface.
You are paying for continuous comparison and for response capacity that is already in place: the device baselines, alert thresholds, update schedule, event records and the one-hour response commitment all accumulate in the quiet months. A month without failures is that machinery working.
Tuning thresholds is what the first month of observation is for. We compare each device against its own long-term baseline rather than one fixed number, and an engineer confirms before anything is booked in. Only when correlation and anomaly detection agree does it become a signal we act on.
Trend comparison needs history: drift in drives, power supplies and wireless coverage usually takes months to show a direction. The first month builds the baseline, the rest accumulates the trend, so 12 months is the shortest period over which managed and unmanaged can honestly be compared. The fee is fixed and continues month to month after the term.
Bring your device list and floor plan. We will survey the site for free, then recommend a tier and a fixed monthly fee.